

By Martin Jansen, Owner of Jansen-PCINFO
I’ve always had a love-hate relationship with Windows. I loved it because it provides me a very good living and hated it because so much can go wrong. People don’t call for help with their computers when they are working perfectly, so I guess, in a way, I can thank Microsoft for their operating system and all the problems it has and will present.
I sometimes compare PC Analysts with Doctors who must diagnose a patient (computer) to see what is going wrong. While Doctors rely on anecdotal evidence along with an exam from the patient to see what is going on, Analysts have some tools built into Windows that allow us to find out what ails our “patient.”
When I examine a computer, I start with the specifications to see what the computer is capable of doing, compared to what it is doing. Time is money, so I want this information quickly.
Pro Tip #1 – Right click (not left click) on Windows Start button to access system information.
I use the Run command and type in cmd to open a command prompt. Then I type in systeminfo for detailed information about the system.
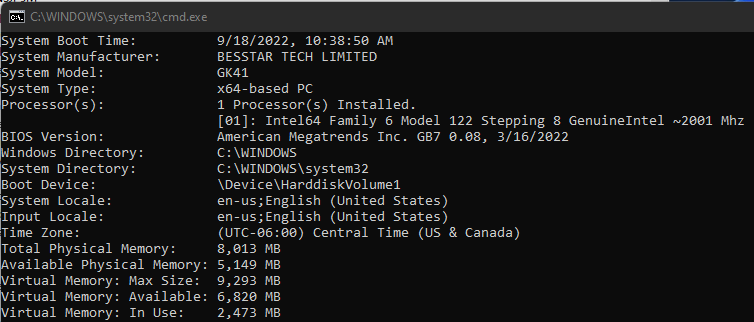
I’m interested in the installed and used memory of the system, the disk space used and the CPU. Unfortunately the CPU information is sparse, I must turn to the Device Manager for more information. Again, I right click on the Start Menu and then select Device Manager.
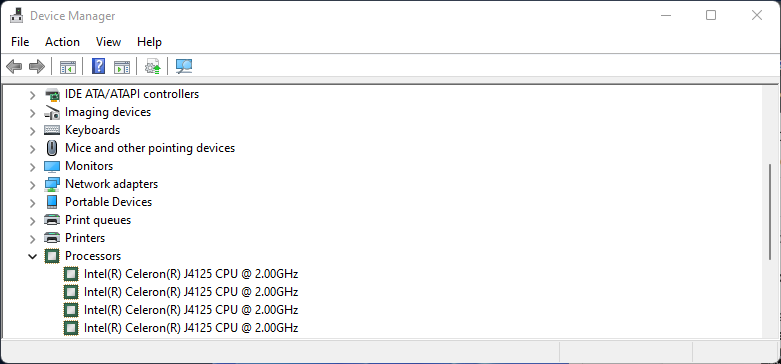
Device Manager will also show me if all my devices are running properly. If not, a warning triangle can be seen. Usually this means that a device is detected, but requires a driver to work.
I see that the system has one Celeron J4125 processor with 4 cores working at 2.00Ghz.
The next command I will run is the Event Viewer. I right click, select Run and type in eventvwr.msc. This utility can give a history of what is failing when loading system services and applications:
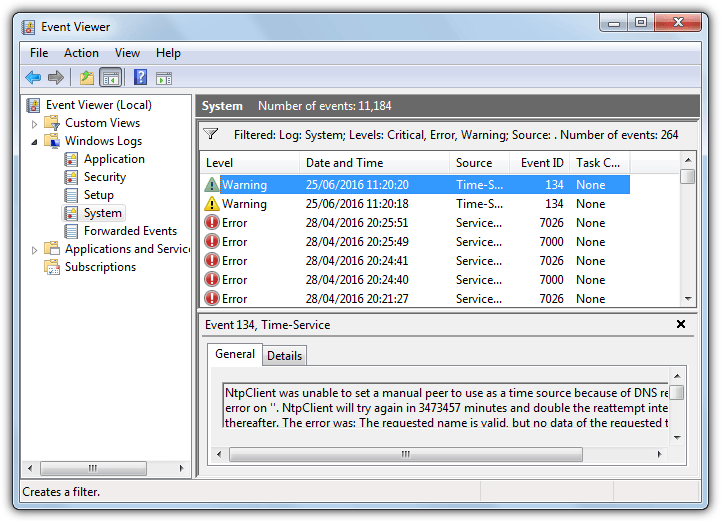
The events are classified as Critical, Warnings and Errors giving possible explanations to the system issues at the bottom of the window. Needless to say, Critical Errors are the worst and can often lead to a dead computer. For instance, I can detect a failing hard drive by looking at the Event Viewer.
The last place I want to look is the Task Manager which gives me a snapshot of the system as it is working. This can be like an X-Ray or MRI of a patient. Right click on the Start Menu and select Task Manager:
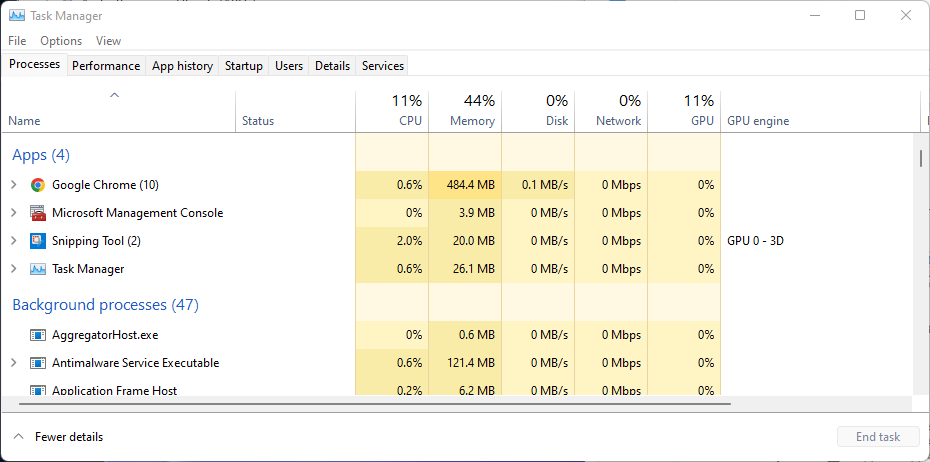
I see that Google Chrome is taking much memory. This is not unusual since modern browsers do the bulk of the work at home and in the office. In the Performance tab of the Task Manager is a graph of the system, also a good indicator of how the system is working at the time:
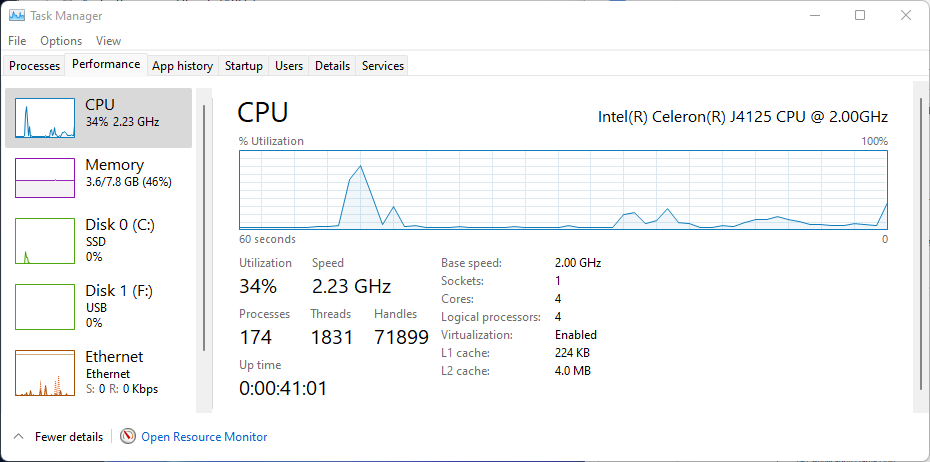
I’ve seen utilization of the CPU that is pegged at 100 percent, making the system incredibly slow and unresponsive.
For example, when I worked at a large insurance company we had a batch of computers that would overheat when running certain Excel calculations. The CPU fan would roar and CPU utilization was through the roof. A physical issue may have been thermal paste deterioration on the CPU, or maybe the Excel macro that was being run taxed the CPU too much. Anyway, after many calls to solve the problem, we eventually replaced the computers with more modern systems.
Pro Tip #2 – Many commands are available from Windows Key + R.
I have a link to these commands in a Google Spreadsheet here.
Yes, there is much that can go wrong with Windows, but, fortunately, there are many tools that allow PC Analysts to determine the cause.